Mathematical Geology, Vol 15, No. 4,1983
Regression Revisited[1]
Isobel Clark[2]
One traditional method of estimating ore reserves is to allocate the arithmetic mean of local samples to each block or stope within the deposit.Ā Thirty years ago, Krige showed that this method produced a "bias " in the estimates, in that high values were commonly overestimated and low values underestimated.Ā This bias became known as the "regression effect" because it could usually be corrected by an empirical regression relationship derived from previously mined areas.Ā This paper shows how the regression effect can be reconciled with the geostatistical method of kriging and how a simple regression line may be derived before any areas are mined out.Ā The method is similar to kriging with known mean, but acknowledges that the overall mean of the deposit may not be known precisely.
KEY WORDS: Kriging, geostatistics, regression effect.
INTRODUCTION
In many vein and reef deposits it is common practice to estimate the internal value of a block or stoping panel using peripheral samples from development drives or from raises.Ā Typically, two opposite sides of a rectangular stoping panel have been sampled, say at 3- or 5-m intervals, whereas development drives may be 30 or even 50 m apart.Ā In some South African gold reefs it is possible to develop on three or four sides of a panel before estimating the content of the slope.Ā The traditional stope estimate was the arithmetic mean of all the peripheral samples.Ā Providing these are evenly spaced around the panel, there seems much intuitive justification for this approach.Ā In most of these deposits fairly intense slope sampling also takes place – partly to aid in immediate local estimation, and partly to check the "actual" value of the panel after it has been mined out.
Krige (1951) was among the first to notice that this method of estimation produced some discrepancy between the value expected in the stope and that actually found.Ā Stopes for which high values had been predicted generally turned out to be somewhat poorer, while low-grade stopes – if they were mined, which was less common – seemed to have higher values than expected.Ā When a graph is plotted of, stope estimator versus actual stope value, it is immediately obvious that the relationship between the two variables is not a 45° line, but one with a shallower slope and a positive intercept on the vertical axis.Ā One could argue for a more sophisticated predictor than a simple straight line, but this leads immediately into the realm of nonlinear estimators such as disjunctive kriging.Ā These more sophisticated estimators are outside the scope of this present paper.
Krige fitted lines through his data using the normal least-squares regression theory.Ā Because of this, the so-called "bias" on stope estimation became known as the regression effect. Ā Without the regression correction payable ground may be left out of the reserves, while seemingly excellent ground leads to disappointing mill feed grades.Ā A regression relationship (linear or otherwise) between the "usual" linear estimator and the "true" stope value is often sufficient to correct this bias and lead to more accurate predictions.
There is only one major disadvantage to the empirical regression approach – it cannot be applied until a substantial amount of stope sample information is available.Ā In the author's experience, at least 25 panels should be available before a preliminary regression line may be evaluated.Ā This imposes a severe limitation on the potential use of the regression approach.
KRIGING
The development of kriging is well documented and will not be repeated here.Ā Suffice it to state that
T* = Σ wigi
where gi are the values (e.g., grades) of the members of the sample set Si; wi are the weights allocated to those samples; and T* is a weighted average used to estimate the true unknown value T. For an unbiased estimator in the absence of trend
Σ wi = 1
Kriging produces the Best Linear Unbiased Estimator, that is, that set of {wi} which produce the minimum estimation variance, by setting up a system of simultaneous equations of the form
Σ wj ![]() i,Sj) + λ
=
i,Sj) + λ
= ![]() (Si,A),
for i= 1, 2, 3, . . . , n
(Si,A),
for i= 1, 2, 3, . . . , n
Σ wj = 1
where ![]() (Si,S)
is the average value of the semivariogram between sample set i
and sample set j and
(Si,S)
is the average value of the semivariogram between sample set i
and sample set j and ![]() (Si,A)
is the semivariogram between sample set i and the
"unknown" area or volume.Ā If
this set of equations is solved, it can be shown that the kriging (estimation)
variance is
(Si,A)
is the semivariogram between sample set i and the
"unknown" area or volume.Ā If
this set of equations is solved, it can be shown that the kriging (estimation)
variance is
σ2k = Σ wi
![]() (Si,A) + λ –
(Si,A) + λ –
![]() (A,A)
(A,A)
There is a variant on this form if it can be assumed that the overall average of the deposit (or suitable subvolume) is known, which will produce a slightly lower estimation variance.
It has been shown elsewhere (cf.Ā Clark 1979c, Rendu 1979) that kriging and its variants may be applied to "two-dimensional" deposits and will produce results which are consistent with that expected from theory.Ā However, when the estimates produced by strict kriging (i.e., with unknown overall mean) are examined more closely, they turn out simply to be the arithmetic mean of the peripheral development sampling. Ā On the other hand, "kriging with known mean" will produce an estimator which closely resembles a linear regression line.
In most cases, then, we are caught between the two situations. Kriging with unknown mean returns the arithmetic average of the peripheral samples, an estimator that is known to be biased; kriging with known mean would help with the bias, but can rarely be applied in practice.Ā Either of these methods could be applied using only development data, if this is all that is available.Ā The alternative empirical approach, which has been proved over 30 years – the regression method cannot be used without a significant amount of stope sample information.
What seems to be needed is a regression line that can be produced before stope sampling is available – or equivalently, kriging with known mean when the overall mean is not known but has to be estimated.
If the following assumptions are made, the regression approach may be stated in geostatistical terms.
(i) The overall volume under consideration is very large compared with the size of a single panel.
(ii) The mean of the whole volume
(global mean μ) may be estimated (![]() ) and
the standard error of this estimate found, σμ,
This might be done by strict kriging, or any other method as desired.
) and
the standard error of this estimate found, σμ,
This might be done by strict kriging, or any other method as desired.
This approach may be expressed mathematically as
T = a + bT* + ε
giving
![]() Ā= a + bT*
Ā= a + bT*
that is, ![]() Āis a simple
regression type estimator.Ā It is assumed
for simplicity that the relationship between T and T* is
linear.Ā Kriging, and hence T*, is distribution free, so that
Āis a simple
regression type estimator.Ā It is assumed
for simplicity that the relationship between T and T* is
linear.Ā Kriging, and hence T*, is distribution free, so that
![]() Ā
should also be unaffected by the distribution of the original
values.Ā It is obvious that for
Ā
should also be unaffected by the distribution of the original
values.Ā It is obvious that for ![]() Āto be unbiassed
Āto be unbiassed
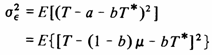
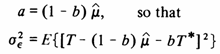
a = (1 - b) μ
It remains to find an estimate of b that will give the "best"
regression line. This regression relationship may then be used to
produce the improved estimator ![]() .
The general form for the estimation variance of
.
The general form for the estimation variance of ![]() Āis
Āis
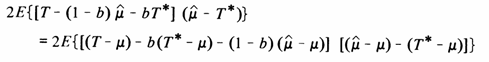
Differentiating this variance with respect to b produces
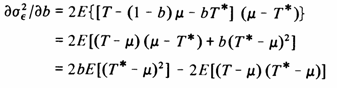
which should be set to zero to find the minimum, giving
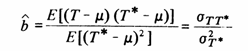
where σTT* is the covariance between the kriging estimator and the true unknown value, and σ2T* is the variance between kriging estimates for all like panels over the whole volume.
This (of course) is the usual least squares regression relationship, and is equivalent to kriging with known mean.
However, in practice μ is not known and the
estimate ![]() Āis used instead.
Once a value is defined for b
Āis used instead.
Once a value is defined for b
and for the minimum estimation variance
![]()
Performing the differentiation gives
Given assumption (i) above and the implicit assumptions of kriging,
![]() Āshould be independent of T and also of T*.
Ā That is, the estimate of the global mean is
independent of the value (or estimated value) of any single panel.
Ā Under this condition many of the
cross-products in the above equation vanish, leaving
Āshould be independent of T and also of T*.
Ā That is, the estimate of the global mean is
independent of the value (or estimated value) of any single panel.
Ā Under this condition many of the
cross-products in the above equation vanish, leaving
which should be set to zero to minimize the estimation variance, giving
![]() (1)
(1)
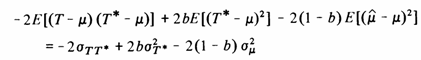
For a deposit which has a semivariogram with a total sill Ctot, the covariance and variance may be expressed in terms of the semivariogram as follows
 (2)
(2)
If T* is the kriging estimator, found by the normal kriging procedure, then the latter term reduces to
![]()
In fact, eq. (1) holds for any linear estimator T*, although it would seem sensible to assume that the kriging estimator is the best one to use.
The calculation of a and b uses only terms that have already been calculated by the kriging system plus the estimate of the global mean and its associated standard error. Ā These latter terms, of course, need only be calculated once for any deposit (or subsection of deposit).
The general form of the estimation variance for any
defined value of b – provided that a =
(1 - b) ![]() – is given by
– is given by
![]()
or in terms of the semivariogram

If μ is known, and ![]() Ātakes the above form, then the estimation variance becomes
Ātakes the above form, then the estimation variance becomes
![]()
where ls has been used to denote the normal least squares estimation.Ā It can also be seen that if b = 1, eq. 3 reduces to the strict (linear) kriging case.
It can be shown analytically that σls is always less than σk. In practice so far, σr has always been less than σk, but (obviously) greater than σls.
To summarize, the technique which is proposed is an attempt to generalize the "kriging with known mean" to the case where the mean is not known, but can be estimated.Ā This gives a more widely applicable method, which seems to take care of the bias problem.Ā The technique is simple and robust in practice, although it obviously does not have the potential power of the nonlinear type of estimator, as proposed in disjunctive kriging and the Multivariate Gaussian approaches of Matheron.Ā The first case study is a short synopsis of the detailed study which lead to the development of the "geostatistical regression" method (georegression).
CASE STUDY 1 - CORNISH TIN LODE
An intensive study of various local estimation methods has been carried out by the author (Clark 1979a) using sample data from the Simms Lode of Geevor Tin Mines, Cornwall.Ā This illustration will consider a geologically homogeneous subsection of the lode, which will be referred to as "Simms West of the Fault" (SWF).Ā Development drives are available at approximately 100-ft levels within this almost vertical lode, and these have been chip sampled at 5-ft intervals. Ā The one exception to this in the study area is the topmost level (6) which was sampled at 10-ft intervals. Ā Four of the levels were extensively mined by the 31st of March, 1976, and a total of about 2700 chip samples were available in a fairly regular pattern throughout these stopes.Ā For this investigation it was decided that panels 125 ft along the strike and approximately 100-ft high (between drives) would be estimated. Ā This gave 49 non-overlapping panels in the study area.
Each panel has up to 52 peripheral samples from drives on two parallel sides, and between 27 and 65 interior samples.Ā Most panels contained about 45 stope samples. Ā It is generally assumed that the interior sampling adequately represents the "true" stope panel average. Ā A typical panel is shown in Fig. 1, with different symbols for drive and stope sampling.

Two variables are measured at each sample site: the assay value of the ore (at that time in pounds per ton of SnO2 and the width of the lode (in inches).Ā For this study, the lode widths have been selected as the variable of interest.Ā For each panel we have peripheral drive samples – on which local estimation would normally be made – and stope samples, which should give an accurate reflection of the stope panel value.Ā It can be shown that kriging produces an estimator that is effectively identical to the arithmetic mean of the peripheral development samples.Ā The one exception to this is in the case of the topmost stope, where level 6 was sampled at a different interval.Ā In that case, the kriging estimator was equal to the average of the two individual drive means.

The semivariogram of the lode widths was calculated from the drive samples only, and is shown in Fig. 2.Ā The model comprises two intermeshed spherical schemes with ranges of 30 and 150 ft, and a small nugget effect.Ā From this we find that using drive samples to estimate the stope panels produces an estimator equal to the arithmetic mean of the samples with a standard error (σk) of about 3.65 in.Ā Over the whole area (SWF) the average lode width is 23 in.
When estimating the value of the stope panel using the stope samples, the kriging system does improve over the arithmetic mean.Ā This is especially true where the spatial distribution of the samples is erratic. Ā Stope estimation standard errors over the 49 panels range between 1.03 and 2.25 in.

The true average lode width value over a stope panel may be denoted by T, the estimate produced from the drive samples by Td*, and that from the stope samples by Ts*. Figure 3 shows a scattergram of Ts* versus Td* for the 49 panels of this study.Ā The 45° line is also shown, and it can clearly be seen that the development average (a linear estimator) produces a consistent bias in the estimation of the stope value.Ā High development values are associated with high stope values, but the value in the stope is generally lower than that in the drives.Ā The reverse is true at the lower end of the graph – the drives systematically underestimate the stopes. Figure 4 shows the relationship of the kriging error to both Ts* and Td*. The estimation errors (Ts*– Td*) are highly correlated with the estimator (r = 0.6) but not with the stope values (r = 0.05). Figure 4a especially illustrates the bias in the estimation. Ā High drive values will give considerable overestimation and vice versa.

With this amount of data it is possible to fit an empirical regression line to the drive/stope relationship.Ā The least squares regression line is shown in Fig. 5, and the discrepancy between it and the 45° line can easily be seen.Ā An envelope has been drawn outlining the data points from the known stopes. Ā The line shown is
Ts* = 7.102 + 0.643 Td*
Classical statistical theory leads to a confidence limit on this line, such as that shown in Fig. 5. This boundary is narrowest close to the mean stope value and widest at the edges of the graph. Ā In theory, a lower α% confidence level is given by

For example, when Td* equals 40 in., the predicted value in the stope is 32.8 in. with a lower 90% confidence limit of 25.6 in.
It is interesting to note that this limit is lower than the corresponding kriging limit, which would be constant at the predicted value minus 1.28 x 3.65 (= 4.67 in.). On the other hand, these confidence limits are based on the assumption that all of the errors are independent and identically distributed, and also that the observations (Ts* and Td*) are randomly and independently collected.Ā These assumptions would not seem realistic in the present case. Ā
Using the geostatistical approach and knowledge of panel geometry, we
find that eq. (3b) may be used to produce a more realistic standard error for
the regression relationship.Ā Since we
are using the overall mean of the stope panels in the calculation of the a coefficient, we may assume that the
global mean is known, so that σμ is zero.Ā
The semivariogram terms
are different for each of the panels, but an average value may be used here,
for illustration purposes.Ā ![]() (S,A) gives
a typical value of 146.3464;
(S,A) gives
a typical value of 146.3464; ![]() (S,S) is
139.0662; and
(S,S) is
139.0662; and ![]() (A,A) is 140.3155.
Since the estimator
being used is the arithmetic mean of the development samples, we can write the
variance formula without weightings, so that
(A,A) is 140.3155.
Since the estimator
being used is the arithmetic mean of the development samples, we can write the
variance formula without weightings, so that
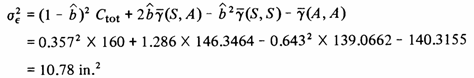
This gives a standard error for the regression line of 3.28 in. and a lower 90% confidence level 4.2 in. below the regression line. Ā Note that this is a major difference between the geostatistical and the classical confidence levels. Ā Both of these lines are shown in Fig. 5.

The difference between these two confidence levels may be explained by the difference in approach between the two theories. Ā The classical statistical approach assumes that the line produced is an estimate of the true line and hence has an error associated with it in addition to the so-called random error. Ā This is why the confidence bands widen toward the edges of the graph.Ā The geostatistical approach assumes that the line is the true one since it is built up from a model of the deposit, and not the local sample values. Ā Perhaps a truly realistic bound would be produced by a compromise between these approaches – where the semivariogram model would be regarded as an estimate of the true model of the deposit.
This empirical regression line has been constructed from 49 stope panels which were estimated using over 2500 stope samples. Ā It can be seen that the standard error of the panel estimates has been reduced from the kriging value of 3.65 in. to one of 3.28 in. using the regression line.Ā This is an improvement in estimation of over 10%.Ā However, by this stage the lode has been nearly half mined. Ā An estimator is required at a much earlier mining stage.
Using eq. (1) and (2) above, a regression relationship can be produced using only the following information
(a) the semivariogram constructed on the drive samples
(b) the size and shape of the stope panel
(c) the drive samples peripheral to the panel
(d) the overall mean of the study area and (if necessary) its standard error
Assuming that no stope samples are available, the procedure is then as follows
(i) estimate the overall mean and its standard error
(ii) for each panel the kriging estimator Td* is produced.Ā In this process the terms
![]()
have been evaluated.
(iii) correct Td* by calculating
![]() Āand
Āand ![]() Āas given in eq. (1), to produce
Āas given in eq. (1), to produce ![]() ,
an improved estimate.
,
an improved estimate.
(iv) calculate the standard error of this estimate using eq. 3.
In practice each panel has a slightly different configuration, and hence
slightly different ![]() Āand
Āand ![]() Āvalues.Ā
To provide an overall "georegression" line for comparison with
the empirical line, the various terms were again averaged over the 49 panels.
Ā The following typical georegression line was
produced
Āvalues.Ā
To provide an overall "georegression" line for comparison with
the empirical line, the various terms were again averaged over the 49 panels.
Ā The following typical georegression line was
produced
![]() Ā= 8.004 + 0.652 Td*
Ā= 8.004 + 0.652 Td*
which has a constant standard error of 3.28 in.

This georegression line, constructed on development data only, is shown alongside the empirical least squares regression line which used over 2500 stope samples, in Fig. 6. The lower 90% confidence limit on the georegression is shown, in addition to the outer envelope of the stope panel data values.
CASE STUDY 2-SIMULATED IRON ORE EXAMPLE
To illustrate the effect of georegression when used as a contouring or point estimation method, a simple set of previously published data (Clark 1979b) has been used. Ā A simplified low-grade iron ore deposit has been sampled by means of 50 randomly positioned boreholes perpendicular to the dip of the orebody (see Fig. 7).Ā This problem is simplified by considering only the average grade over the borehole intersection as a point in two-dimensional space. Ā An area 400 m2 is selected for contouring, and the data is known to have a spherical semivariogram with a range of 100 m and a sill of 25 % Fe2.Ā That is, the standard deviation of the iron grades is 5 % Fe.Ā The average grade of the selected area is estimated to be 34.04 % Fe with a standard error of 0.56 % Fe.
Three different approaches are illustrated here for comparison purposes. These, of course, only represent a selection of the possible approaches that could be used for this problem.

First, "strict" kriging was applied to the data set. Ā That is, only samples which lie within the range of influence (100 m) of a location are used in the estimation of the value at that position.Ā The interpolated map and its corresponding standard error map are shown in Figs. 8a, b, respectively.Ā
It can be seen that the standard errors vary between zero – at a datum point – and 5√2, where there are actually no samples within the range of influence of the point. For the interpolated map, such points have been allocated the value of the nearest sample. Ā These maps were constructed by estimating the value at points on a 5-m grid over the area, that is, a total of 6561 points.Ā On the Imperial College Cyber 174 computer, strict kriging required 45 sec in Central Processor (CP) time.Ā It is useful to note from Fig. 8b the poorly estimated areas in the north and in the southeast corner. Ā The interpolated values in these areas can be seen to be relatively unstable, giving erratic contours as opposed to the smooth variation in the "well" estimated areas.
The second set of maps, in Fig. 9, was produced using all 50 samples in each estimation. Ā For each of the 5-m grid points all samples were included in a kriging system.Ā This is still kriging with unknown mean, but using all available information in every situation.Ā It can easily be seen that in the well-sampled areas (σk< 4) there is no difference in standard error, and little in the predicted values. Ā The standard error contour at 4 % Fe is marginally affected, but the real improvement comes in the really badly estimated areas where the standard error is greater than 4 % Fe. Ā The maximum σk in Fig. 9 is 5.11 % Fe as opposed to 7.07 % Fe in Fig. 8. The new stability can also be seen in the interpolated map, where the unknown area is now assigned a value close to that of the overall average – 34.20 % Fe.Ā Note that this estimator is not equal to the arithmetic mean of all the samples.Ā Table 1 shows the weights accorded to each sample (samples ordered as in Clark 1979b) when estimating these isolated points.Ā Instead of a constant weighting of 0.02, the weights vary between – 0.004 and 0.043. This is, of course, because the kriging system takes into account the relative intersample positions as well as the relationship between sample and point to be estimated.Ā Thus, two sample points close together will share weight, while a relatively isolated point will gain more importance in the estimation.


It is interesting to compare these weights with those accorded to the samples when estimating the overall average of the rectangular area. Ā Table 2 shows the corresponding weights for estimating μ. Once again, the weights vary markedly from the arithmetic mean, ranging from 0.004 to 0.048. The distribution of the weights is quite different from that in Table 1, although the final overall average is similar.
Table 1. Kriging Weights for Isolated Points[3]
| 0.014 |
0.029 |
0.010 |
0.027 |
0.031 |
| 0.017 |
0.018 |
0.004 |
0.031 |
0.014 |
| 0.022 |
0.021 |
0.010 |
0.011 |
0.006 |
| 0.010 |
0.009 |
0.020 |
0.037 |
0.032 |
| 0.043 |
0.032 |
0.036 |
0.007 |
0.005 |
| 0.030 |
0.022 |
-0.004 |
0.027 |
0.012 |
| 0.032 |
0.013 |
0.016 |
0.025 |
0.023 |
| 0.022 |
0.028 |
0.014 |
0.016 |
0.033 |
| 0.011 |
0.004 |
0.021 |
0.014 |
0.035 |
| 0.041 |
0.029 |
0.008 |
0.020 |
0.012 |
Table 2. Kriging Weights for Estimating
Overall Average (![]() )
)
| 0.002 |
0.025 |
0.016 |
0.018 |
0.004 |
| 0.021 |
0.005 |
0.048 |
0.033 |
0.034 |
| 0.020 |
0.026 |
0.021 |
0.028 |
0.016 |
| 0.037 |
0.007 |
0.004 |
0.045 |
0.026 |
| 0.018 |
0.038 |
0.024 |
0.011 |
0.028 |
| 0.021 |
0.036 |
0.016 |
0.027 |
0.035 |
| 0.011 |
0.023 |
0.018 |
0.011 |
0.015 |
| 0.011 |
0.022 |
0.014 |
0.011 |
0.005 |
| 0.015 |
0.015 |
0.010 |
0.029 |
0.012 |
| 0.007 |
0.025 |
0.015 |
0.022 |
0.019 |
It is difficult to quote a relative timing for the production of these maps.Ā Using a generalized kriging routine – that is, estimating each point separately requires an astronomical amount of CP time.Ā To krige just one point using all 50 samples takes 0.80 sec on the Cyber 174. Ā This implies a run-time of something like 5250 sec for the 6561 points on the 5-m grid.Ā On the other hand, writing a tailor-made computer program cuts down the CP requirement.Ā Even then the 5-m grid took approximately 135 sec in CP, a three-fold increase over strict kriging. Ā However, the improvement in prediction would seem to justify the extra expenditure.

The final pair of maps, shown in Figs. 10a, b, were produced using the
georegression correction on a strict kriging estimator.
Ā Effectively, the maps in Fig. 8 were calculated
and then each point corrected by its appropriate geostatistical regression
factors.Ā The regression coefficient ![]() Āwas calculated as described in eq. (1), with a
corresponding
Āwas calculated as described in eq. (1), with a
corresponding ![]() Ācoefficient.Ā
As with Fig. 9 the areas most affected are the poorly estimated
ones.Ā The highest standard error now is
5.03 % Fe, which is not significantly different from that of Fig. 9. However,
it may be noticed in Fig. 10b that the areas with standard errors greater than
5 % Fe have been reduced – one contour in the northwest vanishes entirely.
Ā Comparison of the two interpolated maps,
Figs. 9a, and 10a, show minor differences mainly in the improved areas around
the regions with highest standard error.
Ācoefficient.Ā
As with Fig. 9 the areas most affected are the poorly estimated
ones.Ā The highest standard error now is
5.03 % Fe, which is not significantly different from that of Fig. 9. However,
it may be noticed in Fig. 10b that the areas with standard errors greater than
5 % Fe have been reduced – one contour in the northwest vanishes entirely.
Ā Comparison of the two interpolated maps,
Figs. 9a, and 10a, show minor differences mainly in the improved areas around
the regions with highest standard error.
Georegression estimation of the 5-m grid required 46 see of CP time, plus almost 1 sec to estimate the overall average of the area. Ā This represents an increase in computer time of less than 5% over the strict kriging routine. Ā It is fairly obvious that the more points (or panels) estimated the smaller will be the comparative increase in calculation time.
SUMMARY
The principle of the regression relationship in mining is fairly well established in practice.Ā The ability to quantify the continuity of a deposit by means of a semivariogram and to produce optimal estimators is the main advantage of a geostatistical analysis. Ā These two factors have been combined to produce a simple, robust (possibly nonlinear) estimator to improve the prediction given by linear kriging.Ā Comparative timings on computer runs show that georegression produces a (slightly) better result than the best possible kriging system, in approximately one-third of the CP time.Ā Of course, this factor will vary from one application to another. Ā The more samples available, the greater will be the advantages of using the georegression approach. Ā Programming the georegression correction into an existing kriging system requires the addition of only four or five lines of code.
The two case studies which have been discussed illustrate the application of this method.Ā Another two case studies with somewhat less ideal characteristics are presented elsewhere (Clark and Clausen, 1981).
ACKNOWLEDGMENTS
The georegression method was developed as part of the research undertaken for the degree of Ph.D. from the University of London. Ā The author particularly wishes to thank the staff at Geevor Tin Mines Ltd. for their help and encouragement during that study.Ā The simulated iron ore example was produced for Clark (1979b) by R. P. B. Durham at Imperial College .
REFERENCES
Clark, I., 1979a, Geostatistical reserve estimation in Cornish tin mining: Unpublished Ph.D. thesis, University of London, 360 p.
Clark, I., 1979b, Practical geostatistics: Applied Science, Barking, Essex, 129 p.
Clark, I., 1979c, Does geostatistics work?: Proceedings of the 16th APCOM Symposium, Tucson, Arizona (SME-AIME Publ), pp. 213-225.
Clark, I. and Clausen, F. L., 1981, Simple alternative to disjunctive kriging: Trans. Inst. Min.ĀMetall., v. 90, pp. A13-A24.
Jackson, M. and Marechal, A., 1979, Recoverable reserves estimated by disjunctive kriging: a caseĀstudy: Proceedings of the 16th APCOM symposium, Tucson, Arizona, p. 240-249.
Krige, D. G., 1951, A statistical approach to some basic mine valuation problems in the Witwatersrand: Jour.Ā Chem.Ā MetaR.ĀMin.Ā Soc.Ā S. Afr., v. 52, p. 119-139.
Matheron, G., 1975, A simple substitute for conditional expectation: disjunctive kriging, in Guarascio, M., Huijbregts, Ch.Ā J., and David, M., (Eds.), Advanced geostatistics in the mining industry: D. Reidel (Dordrecht-Holland), p. 221-236.
Rendu, J. M., 1978, An introduction to geostatistical methods of mineral evaluation: S. Afr.Ā Inst. Min.ĀMetall., Monograph Series, 61 p.
Rendu, J. M., 1979, Kriging, logarithmic kriging and conditional expectation: comparison of theory with actual results: 16th APCOM symposium, Tucson, Arizona , p. 199-212.
[1] Manuscript received 25 November 1980; revised 1 June 1982.
[2] Formerly Department of Mineral Resources Engineering, Imperial College of Science and Technology, London SW7 2BP, England.
[3]Order as in Clark, 1979b